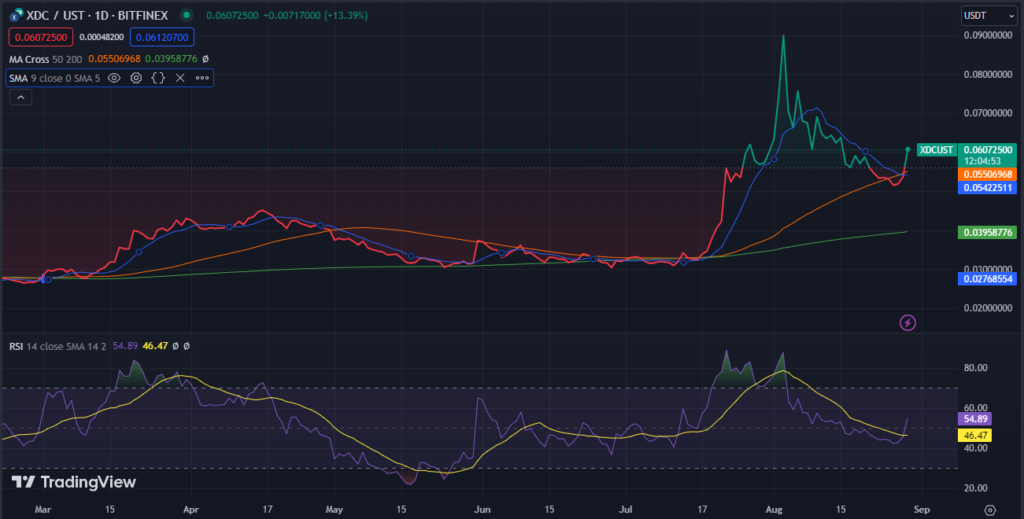
- XDC Network (XDC) has surged by over 19% in the past 24 hours.
- XDC is trading at $0.06106 with a daily trading volume of $10.8 million, up 16% in a single day.
While major cryptocurrencies such as Bitcoin (BTC) and Ethereum (ETH) are trading in relatively flat ranges, XinFin Network’s native cryptocurrency, XDC, has grabbed the spotlight with a significant rally of over 19% in the past 24 hours.
At the time of writing, XDC is trading at $0.06106 with a daily trading volume of $10.8 million, marking a substantial 16% surge in a single day. The coin has emerged as one of the top gainers in the market, catching the attention of investors and traders alike.
Earlier this month, on August 3rd, the leading cryptocurrency XDC experienced a remarkable surge, hitting a one-year all-time high in the range of $0.08. This surge represented a staggering 300% increase from its year-low of $0.03.
Following this surge, XDC’s price displayed a period of consolidation, trading in the range of $0.07 to $0.06. However, a dip occurred on August 17, bringing the price down to the $0.05 range. That fits with a similar market scenario in the global cryptocurrency landscape.
What’s Next for XDC?
In an attempt to reclaim lost ground, XDC demonstrated resilience and managed to recover from the dip. A closer analysis of the daily price chart reveals that XDC has surpassed the short-term 50-day simple moving average (50 SMA). That suggesting prevailing market sentiment remains bullish, potentially driving the upward momentum.

Additionally, XDC’s daily Relative Strength Index (RSI) stands at 55 indicating overbought conditions, possibly leading to a near-future corrective pullback. If the current trend continues, XDC’s price could potentially target resistance levels at $0.07690 and $0.12866. Conversely, if the trend reverses, the cryptocurrency may find support at levels of $0.05673 and $0.04682.
Moreover, the 50-day moving average (50 MA) of the XDC Network has crossed above the 200-day moving average (200 MA). The crossing of the 50 MA above the 200 MA is a technical analysis indicator often referred to as a “Golden Cross.” Signaling potential price growth ahead for this altcoin.
Recommended for you
