The distribution of Ethereum’s supply speaks volumes about market sentiment, potential price movements, and ecosystem health. Knowing which addresses — be they whales (massive holders), sharks (substantial holders), or shrimp (small holders) — own how much ETH can provide invaluable insights into market trends and potential future movements.
For context, let’s consider Bitcoin (BTC). Historically, the behavior of Bitcoin whales and other large holders has been seen as a significant predictor of market direction. If they start to offload their holdings, it often signals a bearish phase. Conversely, when they accumulate, the market can expect bullish movements.
Ethereum, by contrast, has a more complex ecosystem. While Bitcoin is primarily a store of value, Ethereum’s utility as a platform for decentralized applications means its holders might have different motives. Thus, while both cryptocurrencies might see similar trends in holdings, the reasons and outcomes can vary significantly.
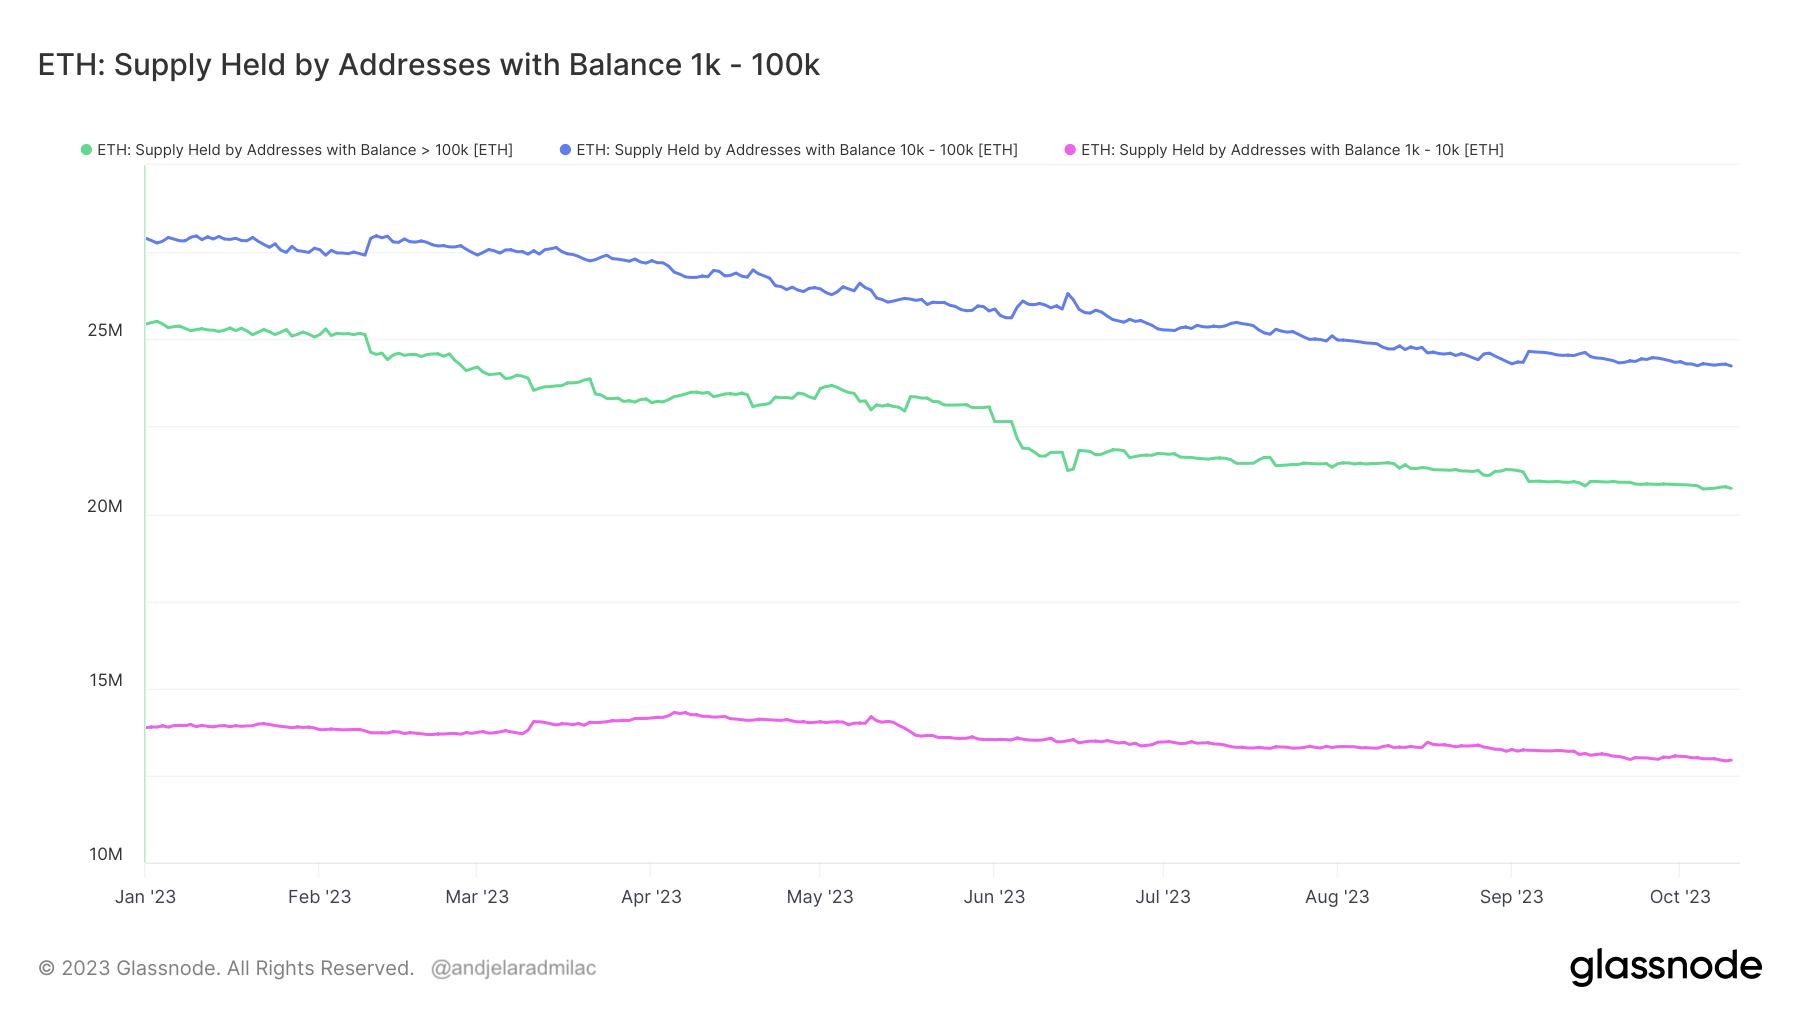
There’s been a significant drop in ETH held by whales and other large holders since the beginning of the year.
Glassnode data reveals that addresses with a balance of over 100,000 ETH saw their holdings plummet from 28.9 million ETH in October 2022 to just 20.7 million ETH a year later. This is a stark decrease of 4.7 million ETH in 2023. Similarly, addresses holding between 10,000 and 100,000 ETH shed 3.5 million ETH, and those with balances between 1,000 and 10,000 ETH reduced their holdings from 13.8 million ETH to 12.9 million. Meanwhile, addresses with 100 to 1,000 ETH and 10 to 100 ETH balances have seen drops of around 800,000 ETH and 200,000 ETH respectively this year.

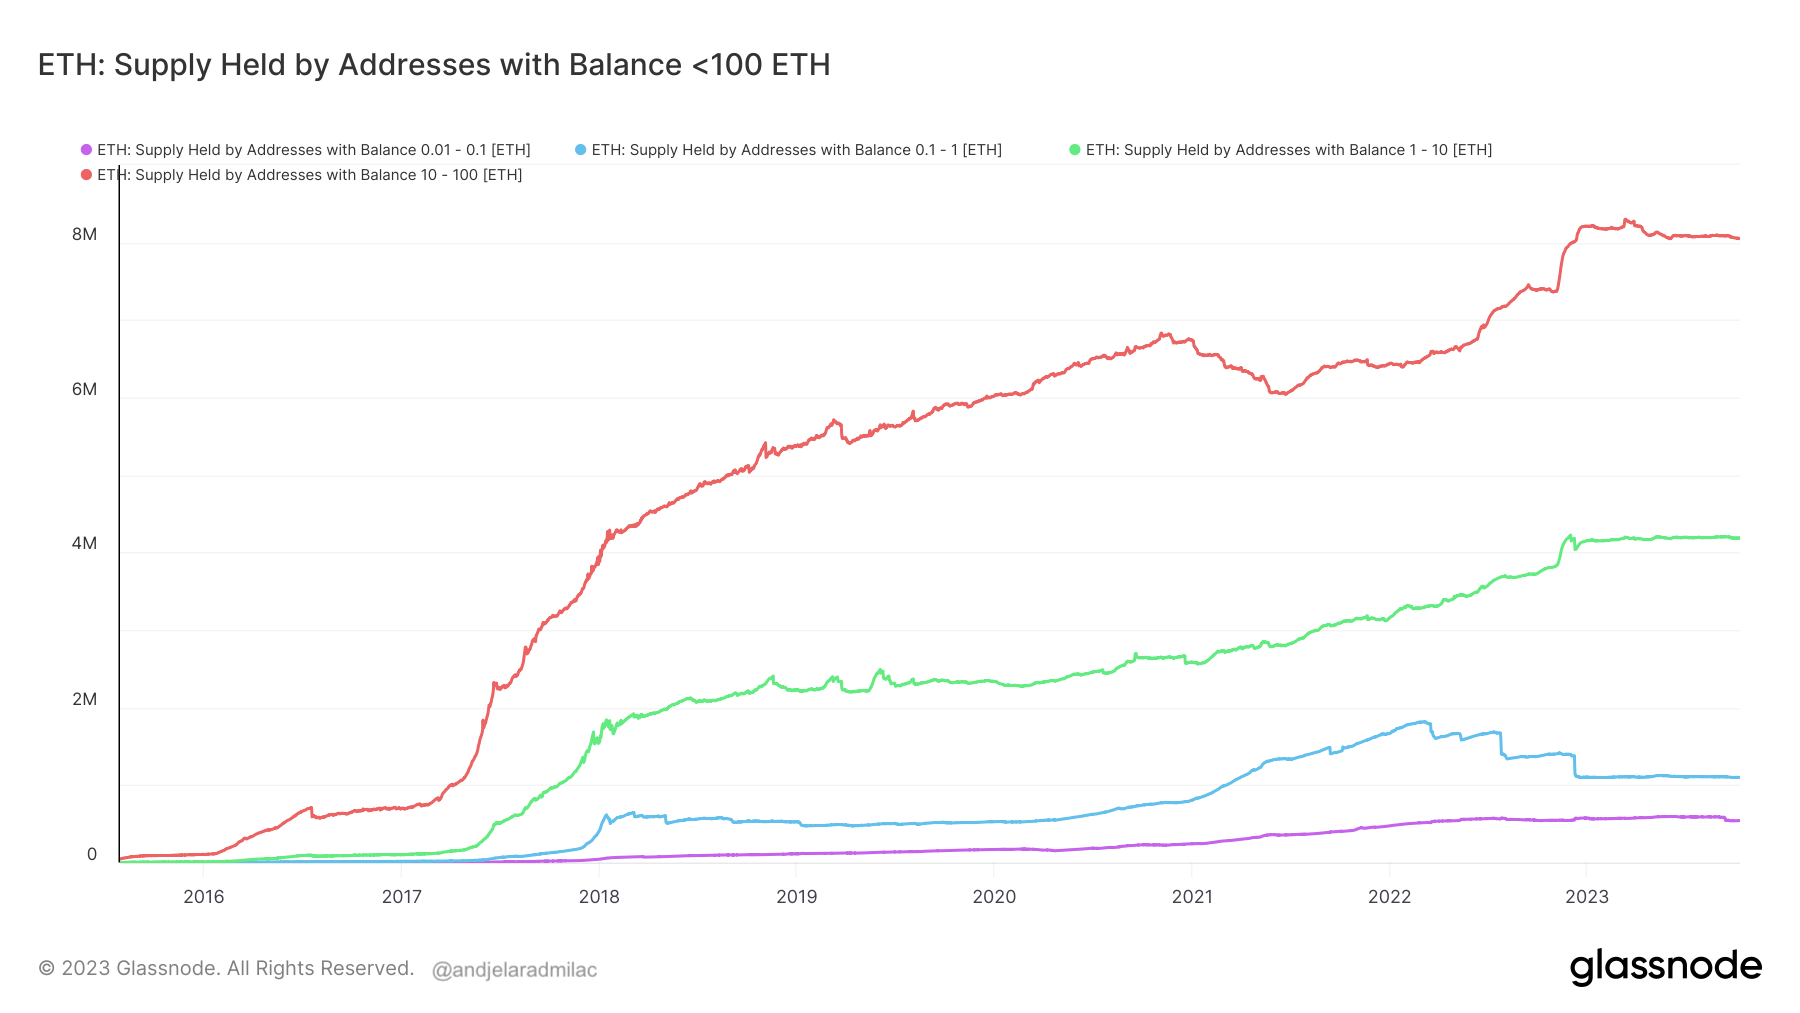
Looking at the smaller fish in the Ethereum sea shows a different market dynamic. Holders with balances between 1 and 100 ETH have remained relatively stable throughout the year, with only marginal increases. However, the tiniest holders, those with less than 0.01 ETH, saw a notable uptick, accumulating an additional 21,860 ETH since January.

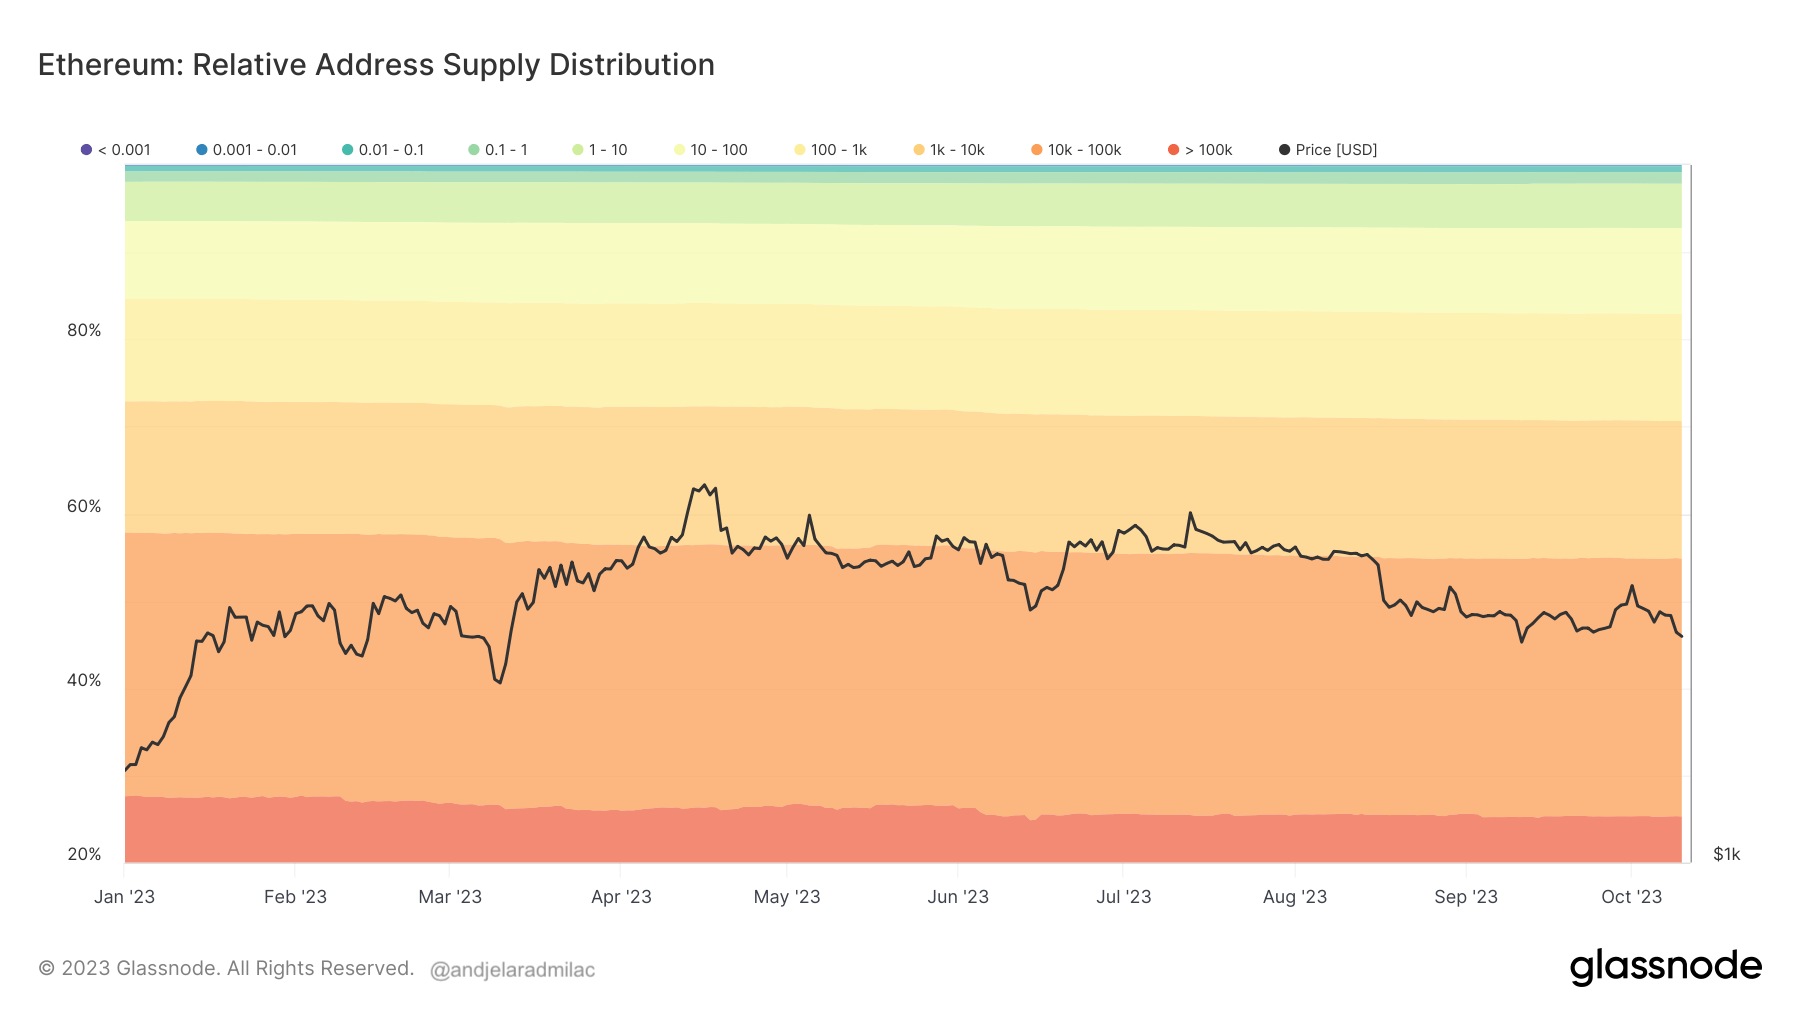
Despite the declines among the larger holders, the supply distribution still shows Ethereum’s majority supply resting in the hands of substantial addresses. As of October 10, 29.5% of Ethereum’s supply is held by addresses with 10,000 to 100,000 ETH balances. In comparison, a quarter (25.2%) of its supply is in the wallets of the whales, those with over 100,000 ETH.

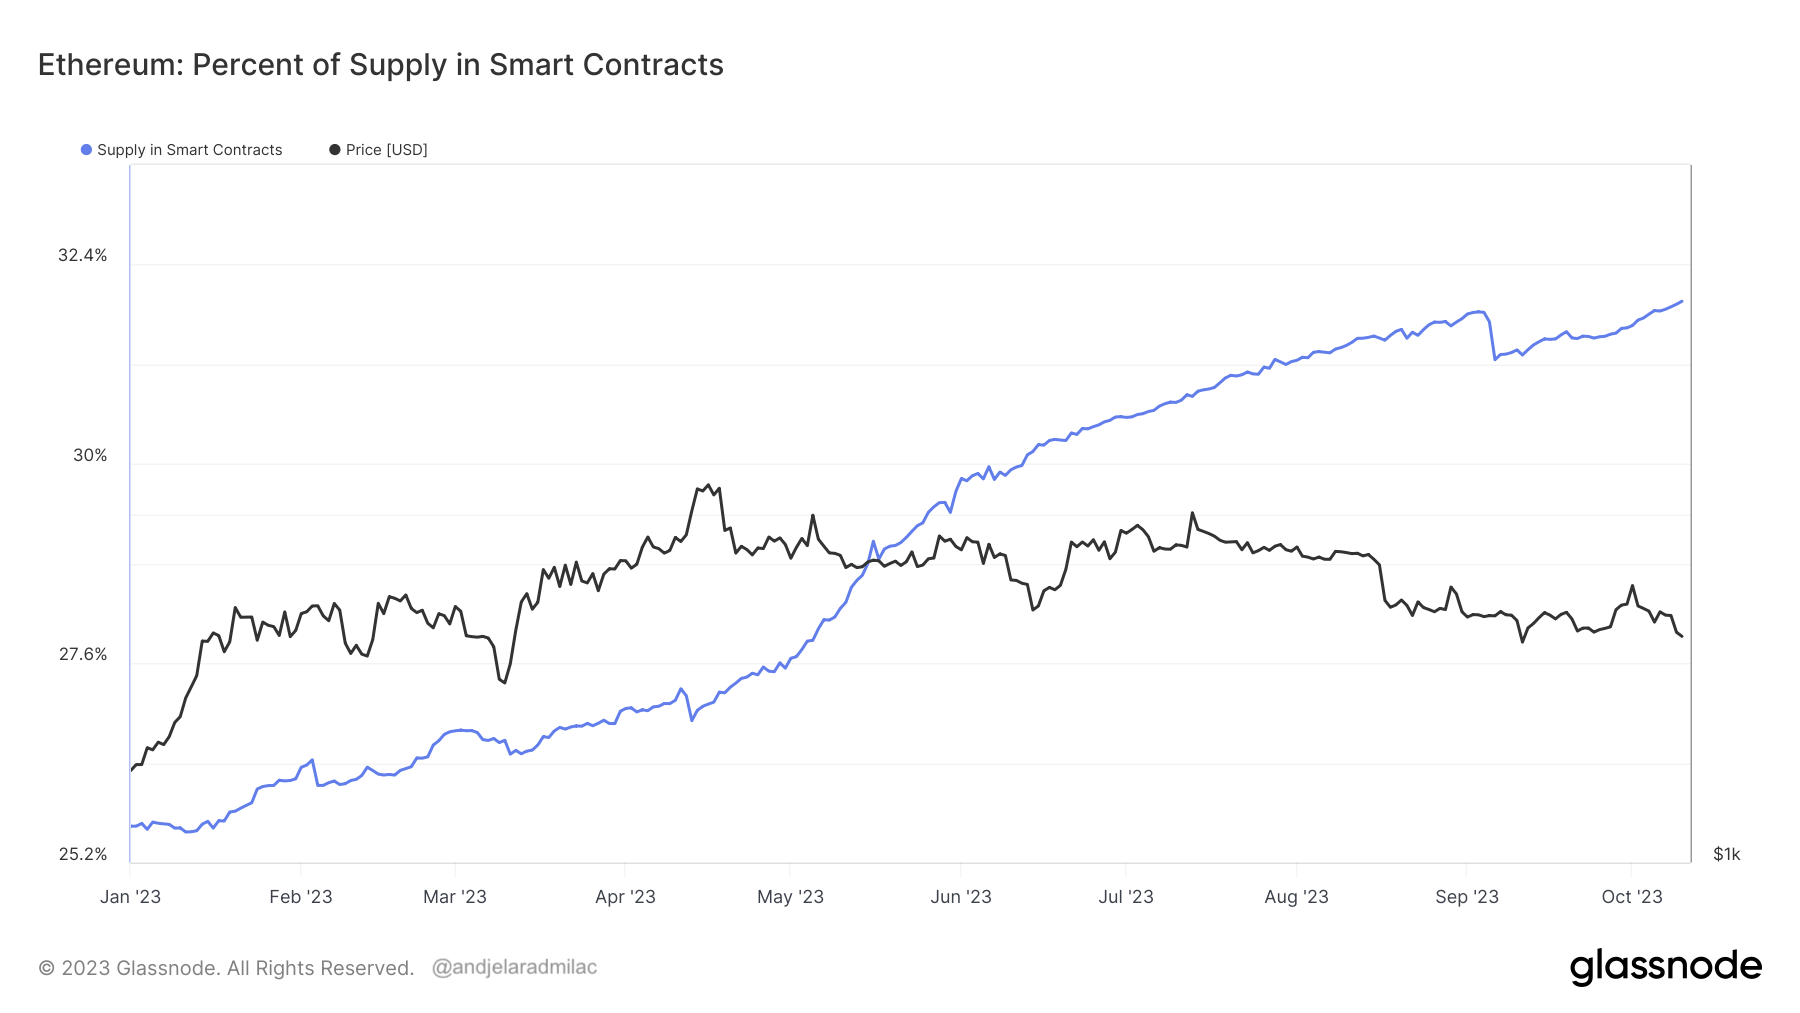
But what does this shift indicate? A simple assumption might be that whales are selling off. However, diving deeper into on-chain metrics offers another perspective. The percentage of Ethereum’s supply locked in smart contracts has surged this year, from 25.6% to 31.9%.

This increase suggests that while large holders might be decreasing their liquid ETH holdings, they aren’t necessarily leaving the Ethereum ecosystem. Instead, they might be locking their assets into DeFi projects, staking, or other smart contract-driven initiatives.
The post Diving into Ethereum’s changing supply landscape appeared first on CryptoSlate.
