The crypto market witnessed a tumultuous sell-off, pushing Bitcoin’s price to $25,000. While the price has slightly recovered in the past week, stabilizing around $25,900 over the weekend, it remains in a precarious position. Several on-chain metrics suggest that Bitcoin might be trapped in a phase of sideways movement in the upcoming weeks. One such metric is the realized profit/loss momentum, an innovative indicator recently introduced by Glassnode.
The metric is designed to identify significant market turning points, such as peaks or troughs in market trends. The metric is derived from the Short-Term Holder (STH) Realized Profit/Loss Ratio, which is then compared to its one-year moving average.
Short-term holders play a pivotal role in the market dynamics. They are typically active throughout market cycles and are statistically more likely to react to market volatility. This is because recent transactions or coin acquisitions are likely influenced by recency bias regarding the coin’s cost basis. Therefore, any price movement above or below this level is more likely to prompt a response.
Moreover, market extremes often lead to wealth being transferred, resulting in an increased proportion of wealth held by STHs. Monitoring the momentum shifts for STHs realizing profit or loss can signal potential inflection points in macro market trends.
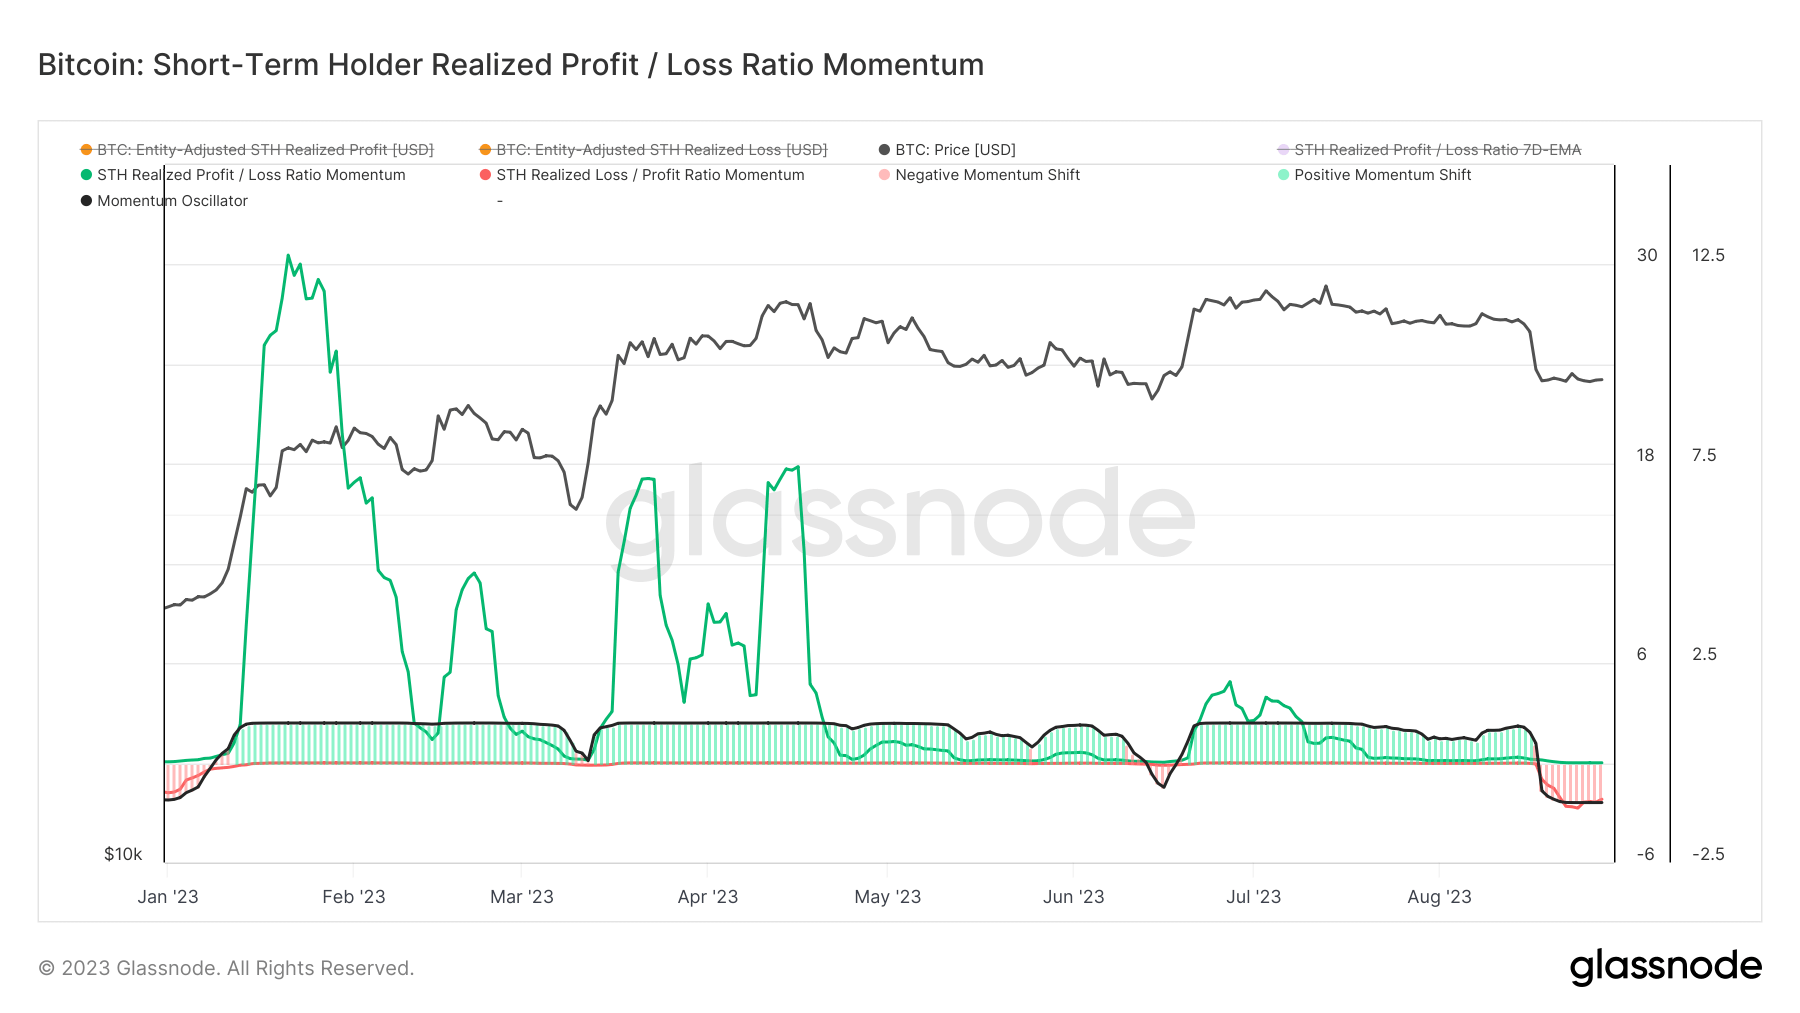
The momentum of short-term holders’ realized profit/loss ratio suggests that short-term holders have seen a decline in profit dominance since January. The brief surge to over $30,000 in June led to a minor spike in profit-taking momentum. However, this uptrend was short-lived.

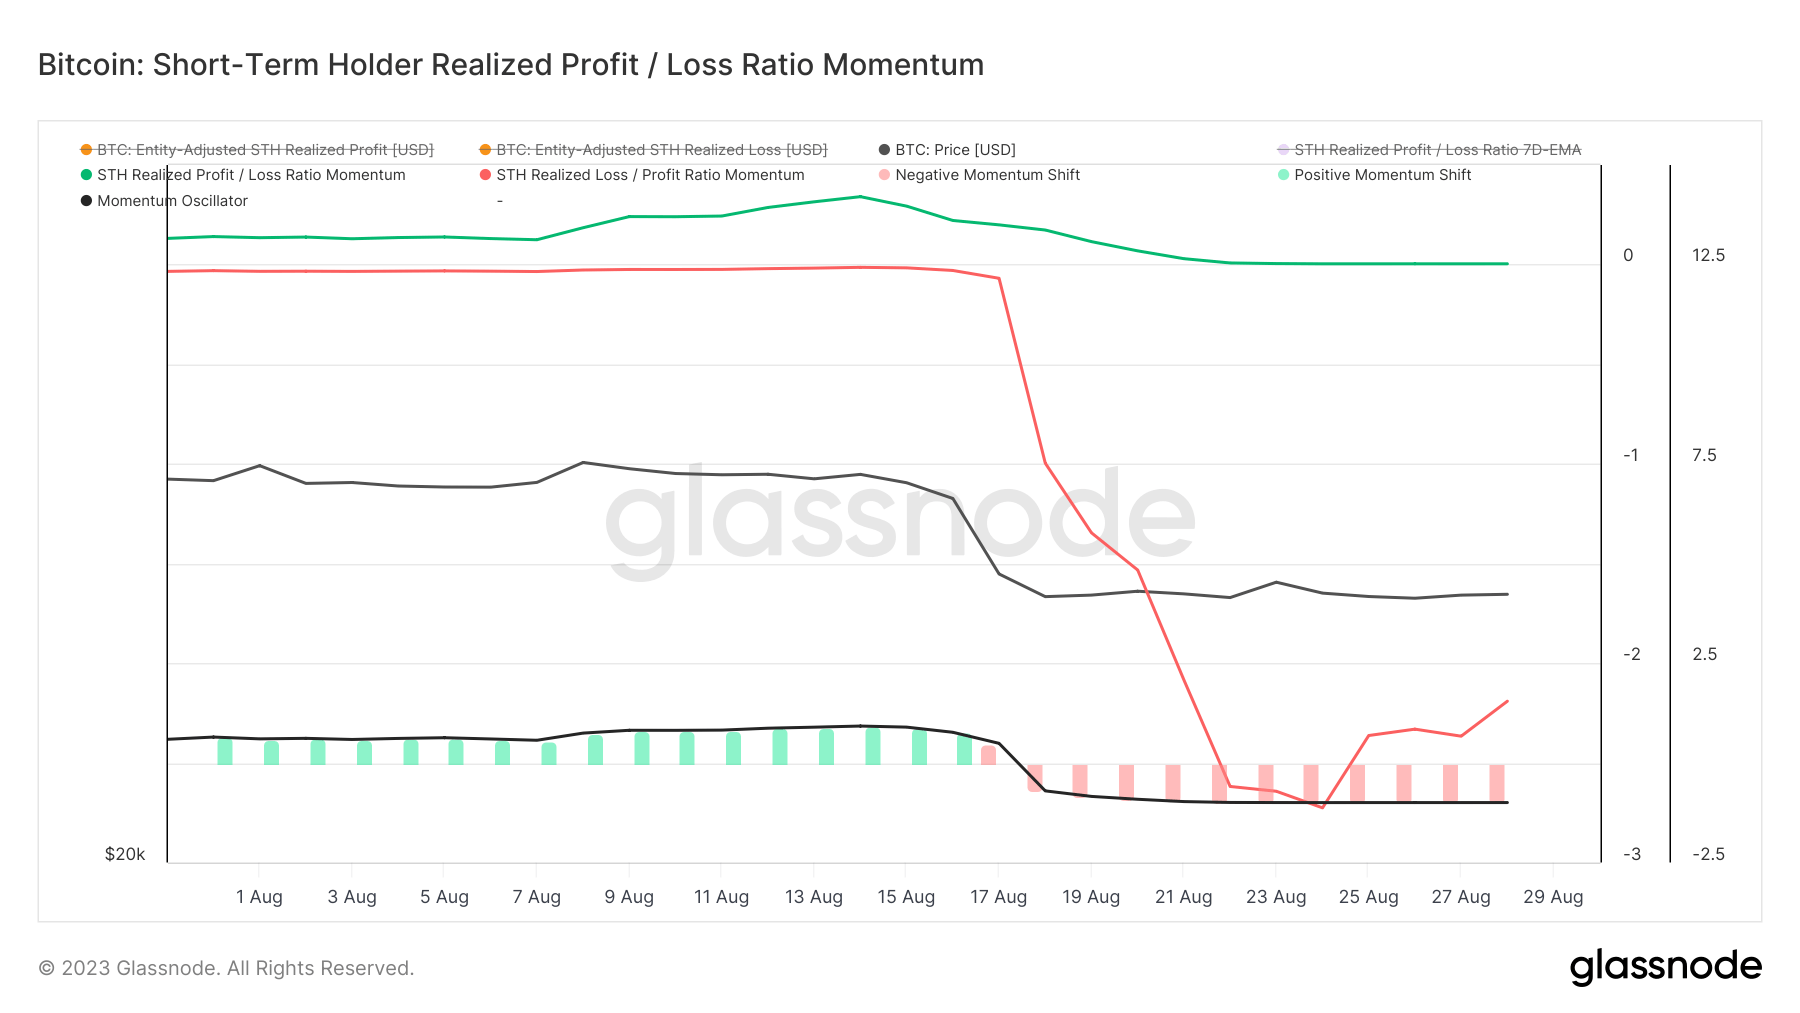
Soon after, the realized profit dominance began its rapid descent, transitioning to a loss-dominant regime on Aug. 17, correlating with Bitcoin’s drop to $26,000. By Aug. 24, the momentum plummeted to its lowest in a year, still entrenched in a loss-dominant phase.

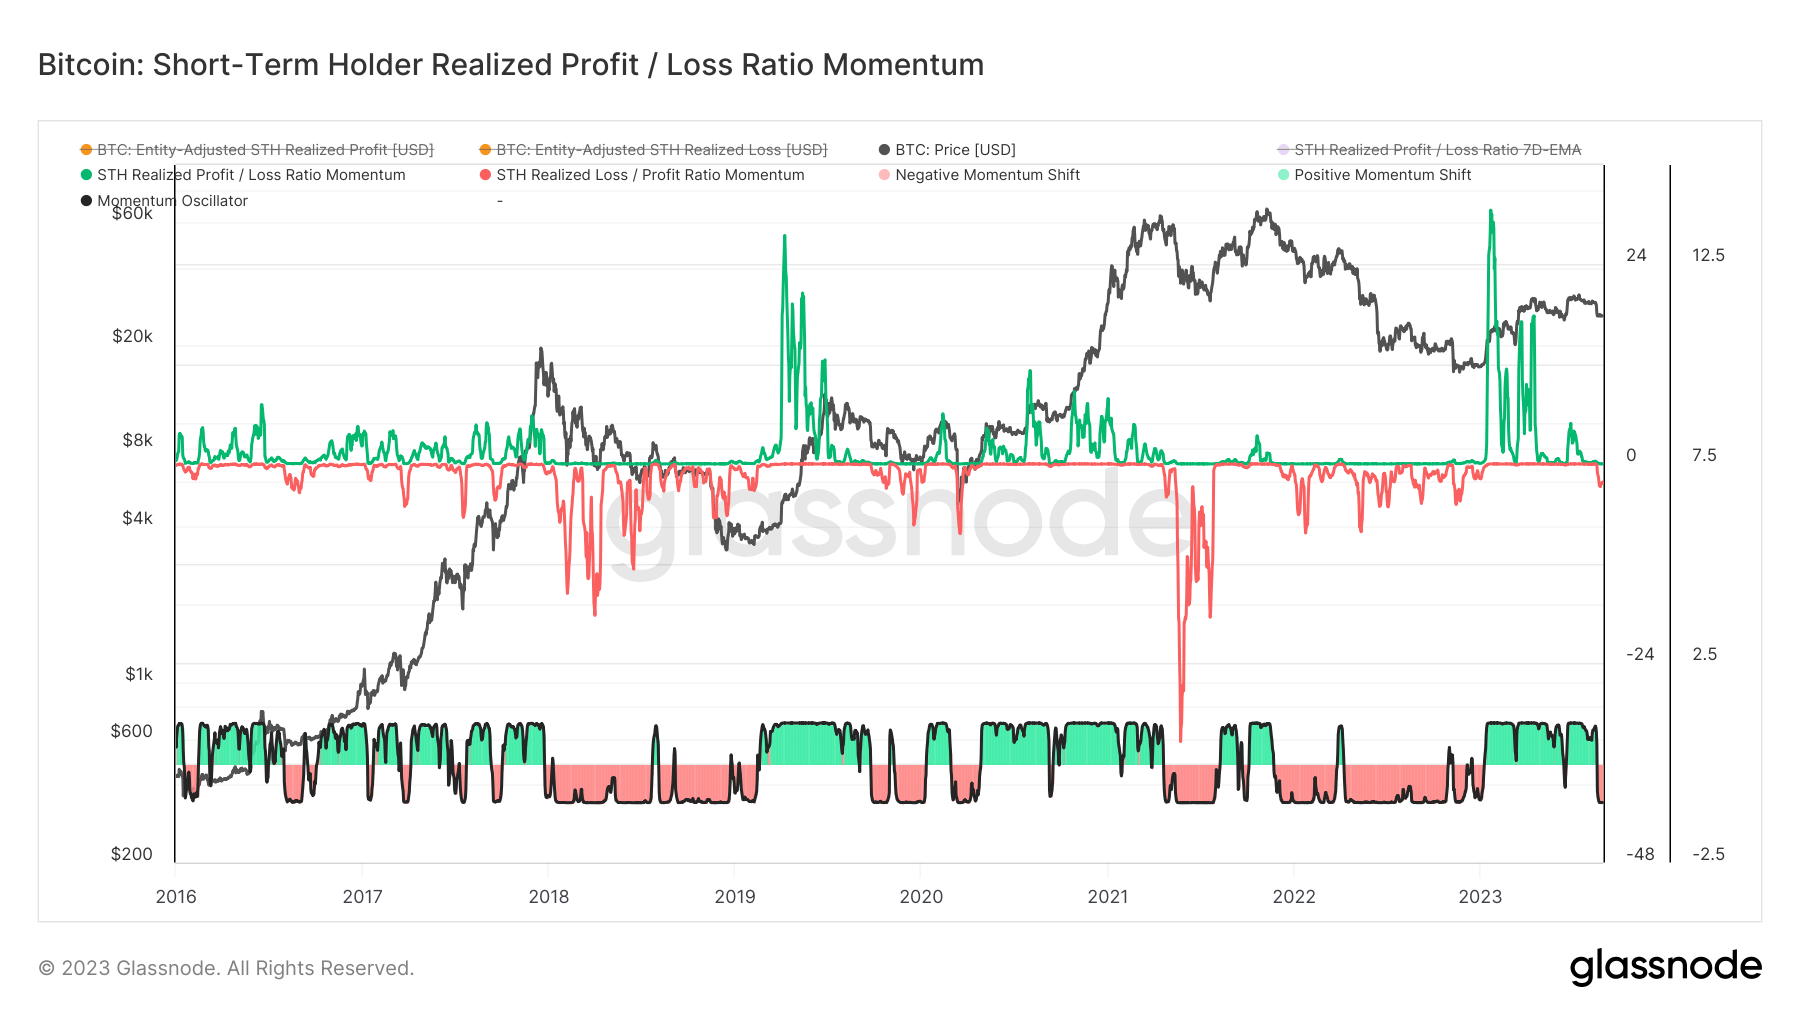
Historically, surges in realized loss momentum following periods of significant profit-taking momentum have spanned several months. During market rallies, realized profit accelerates as STHs that recently acquired coins enter a profit phase. Conversely, market corrections lead to an acceleration in realized loss, pushing STHs who recently acquired coins into a loss, inducing panic.

Based on the historical data and current trends, Bitcoin could potentially face a volatile few weeks if it follows historical patterns. The sustained decline in profit dominance, coupled with the recent sell-off, could make for a choppy September.
The post Navigating Bitcoin’s sideways trend with realized loss momentum appeared first on CryptoSlate.
